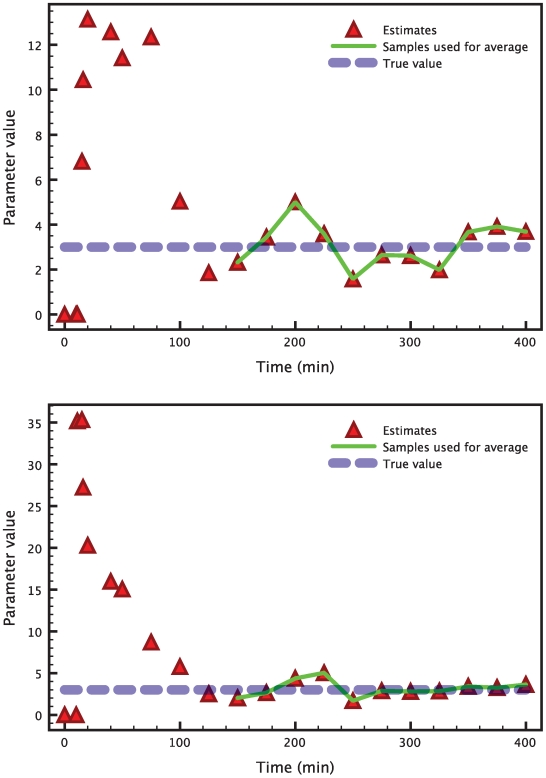
Figure 3. Time evolution of the Kalman filter parameter estimates in the heat shock model.
After an initial transient, the estimates of the two parameters  (top) and
  (bottom), represented by the triangles, keep oscillating around the respective true values (blue dashed line). The last 10 samples (connected by the green line) are averaged to extract a single number from this time-varying signal.

