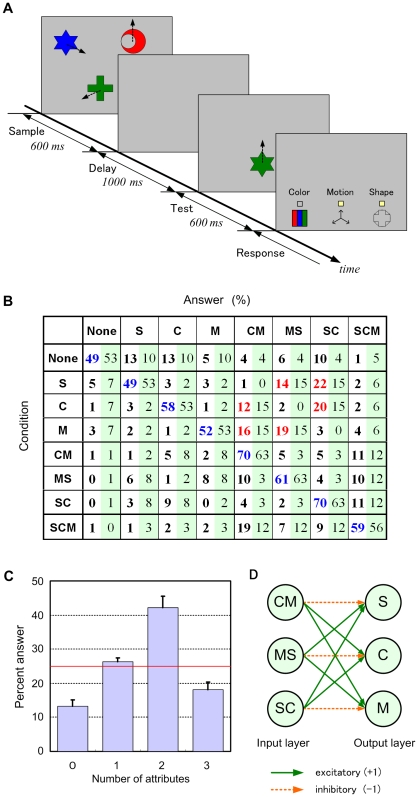
Figure 3. Empirical and simulation data from a change-detection task.
(A) Procedure for a single trial in Experiment 3. (B) Distribution of subjects' answers for each case. The left value in each cell is an empirical percentage, and the right value is that calculated by the model in (D) with best fit parameters of c = 2 and p = 0.1. Blue numbers in the diagonal cells indicate correct answers, and red numbers indicate an illusory change in an attribute caused by a change in another attribute. (C) Percentage of the number of attributes judged to be changed. The red line indicates the actual percentage. Error bars indicate s.e.m. (n = 10). The differences between the two-attribute condition and the other conditions were significant (P<0.01). (D) Two-layer network for converting changes in individual attributes from changes in attribute pairs.

