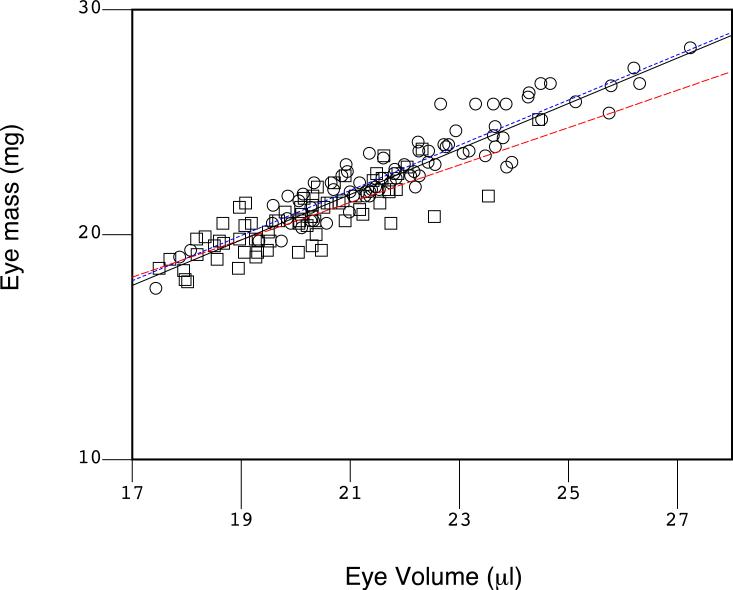
Figure 9.
Density of the mouse eye. The volume of the eye was approximated as a prolate spheroid and plotted on the X-axis against the measured weight of the eye on the Y-axis. A least squares linear regression was conducted (black line; pooled data), and the slope of the line indicated the density of the eye as 1.013 mg/μl. The coefficient of determination (R2 = 0.852) suggests that both measurements tools, the laser micrometer and the analytical balance, were accurate and precise, and there was little variation in the density of the eye. Deviations would indicate significant problems in eye growth. The rd10 mice are indicated by squares and WT C57BL/6 with circles. Regression lines for each group are illustrated (red for rd10 and blue dashes for C57BL/6). These two groups were not different based on the slope and the intercept of the regression lines. However, based on a coincidence test (Glantz, 1997), there is an improvement (F=7.607, P<0.001) by fitting the two sets of data to two lines (blue dots for the C57BL/6; red dashes for the rd10) over a fit of the pooled data to a single regression line (black solid line).

