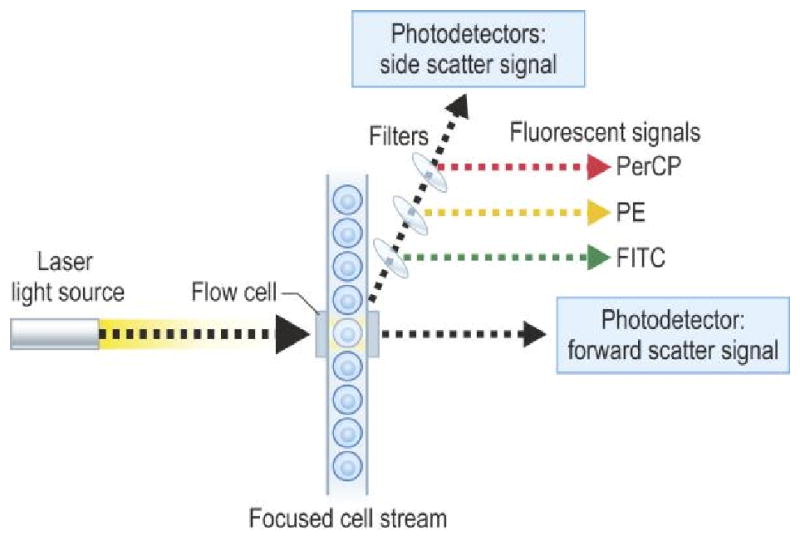
Figure 1.

Figure of flow chamber and presentation of data of CD8/CD4 as dot plot (A) and contour plot (B).
from Rich RR, Fleischer TA, Shearer WT, Schreder HW, Frew AJ, Weyand CM. Clinical Immunology Principles and Practice, Third edition. Chapter 97, page 1436, Figure 97.1. Reprinted with permission.
