Figure 3.
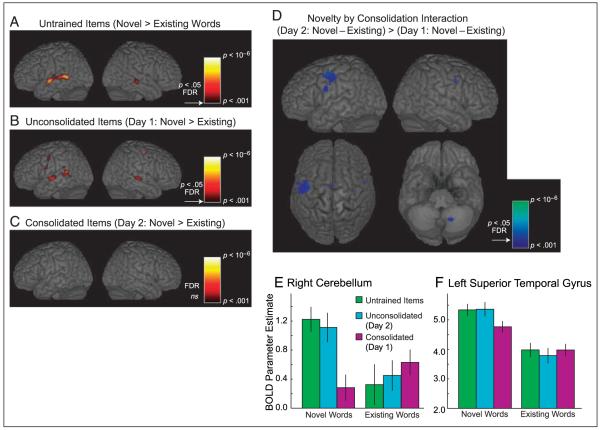
Brain regions showing response differences between novel and existing spoken words (pause-absent trials) in the fMRI experiment rendered onto the MNI canonical brain. (A) Untrained novel > existing words, thresholded at p < .001 uncorrected, all activations shown exceed FDR corrected p < .05. No voxels show an elevated response to existing words. (B) Unconsolidated novel > existing (comparison of items trained on Day 2) thresholded as before. (C) Consolidated novel > existing words (comparison of items trained on Day 1), thresholded at p < .001 uncorrected, no voxels approach FDR p < .05. (D) Brain regions showing an interaction between novelty and consolidation (i.e., an additional response for novel words trained on Day 2, not seen for novel words trained on Day 1), results displayed at p < .001, all peak voxels in the left hemisphere and right cerebellum exceed FDR corrected p < .05, as indicated by the arrow on the color scale. (E) Mean BOLD parameter estimate (peak of the fitted canonical HRF function on an arbitrary scale) of the peak voxel in the right cerebellum (x = 16, y = +60, z = −36) for novel and existing words in each of the training conditions. Error bars show SEM after between-subject variance has been removed, suitable for repeated measures comparisons between conditions (Loftus & Masson, 1994). (F) Response profile of a cluster of voxels in the left STG (center of mass, x = −54, y = −30, z = +6), which show an elevated response to novel words and a significant interaction between novelty and consolidation. Error bars as in panel E.

