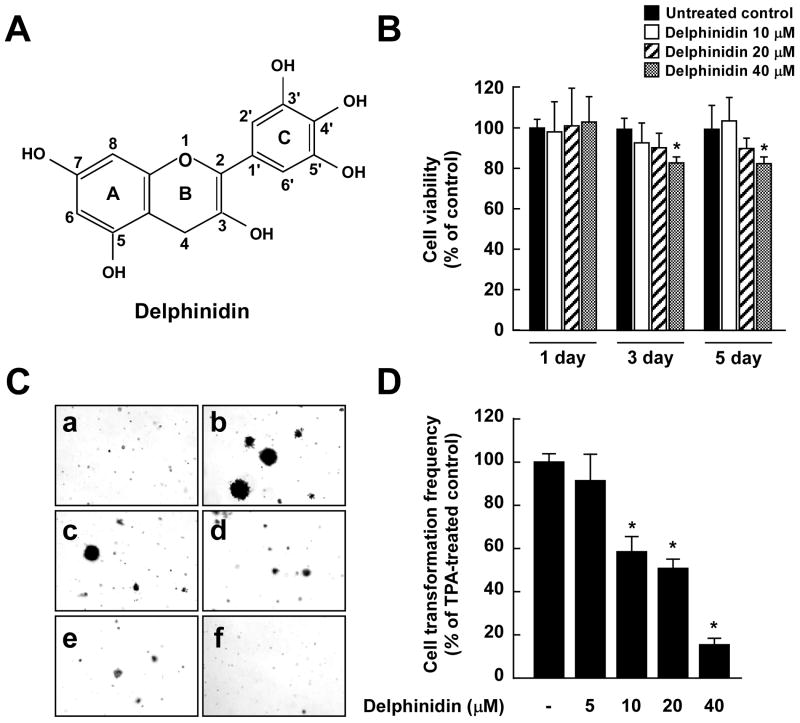
Fig. 1.
Effects of delphinidin on TPA-induced neoplastic transformation of JB6 P+ cells. A, Chemical structure of delphinidin. B, Antiproliferative effects of delphinidin on JB6 P+ cells. JB6 P+ cells were treated with delphinidin (0–40 μM) or its vehicle, DMSO (< 0.1%, as a negative control), in 5% FBS/MEM for the indicated time period. The proliferation of cells was determined by the MTT assay as described in “Materials and Methods”. Data are presented as mean and S.D. values from three independent experiments. The asterisk (*) indicates a significant difference (p < 0.01) compared to untreated control. C, Delphinidin inhibits TPA-induced cell transformation. JB6 P+ cells were treated as described in “Materials and Methods”, and colonies were counted 14 days later: (a) untreated control; (b) TPA alone; (c) TPA and 5 μM delphinidin; (d) TPA and 10 μM delphinidin; (e) TPA and 20 μM delphinidin; and (f) TPA and 40 μM delphinidin. D, Cell colonies were counted under a microscope with the aid of Image-Pro Plus software (v4). The effects of delphinidin on cell transformation of JB6 P+ cells are shown as the percent inhibition of cell transformation in soft agar by delphinidin relative to TPA-only stimulated cells. Data are presented as mean and S.D. values from three independent experiments. The asterisk (*) indicates a significant difference (p < 0.01) between groups treated with TPA and delphinidin and the group exposed to TPA alone.

