
Fig. 6.

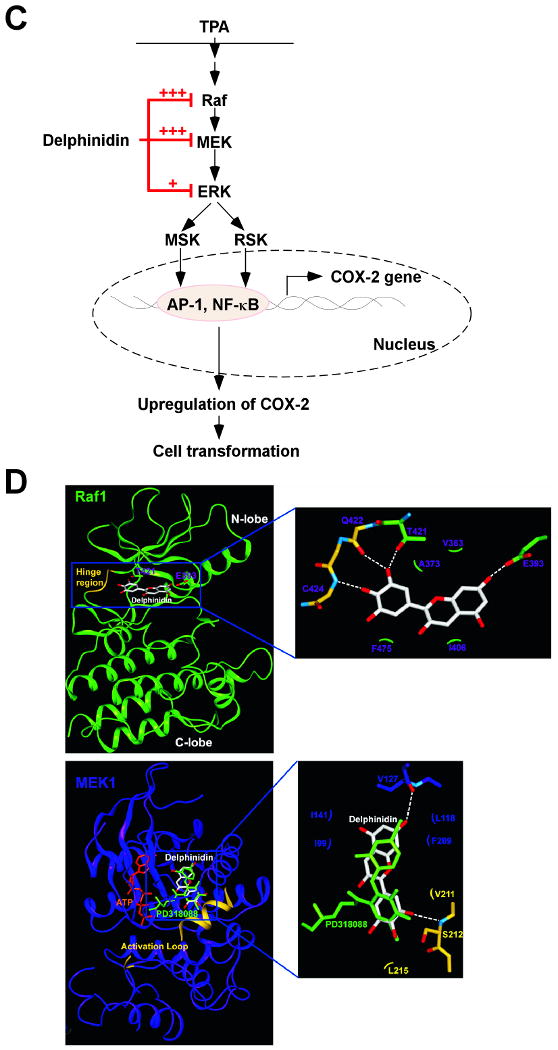
Effects of delphinidin on H-Ras- or EGF-induced cell transformations and the proposed molecular mechanisms for inhibition of neoplastic cell transformation by delphinidin. A, (left panel) H-Ras- transformed JB6 cells were treated as described in “Materials and Methods”, and colonies were counted 14 days later: (a) untreated control; (b) 5 μM delphinidin; (c) 10 μM delphinidin; (d) 20 μM delphinidin; and (e) 40 μM delphinidin. (right panel) Delphinidin inhibits H-ras-induced cell transformation. Cell colonies were counted under a microscope with the aid of Image-Pro Plus software (v.4). The effects of delphinidin on cell transformation of JB6 P+ cells are presented as the percent inhibition of cell transformation in soft agar by delphinidin relative to untreated H-ras-transformed cells. Data are presented as mean and S.D. values from three independent experiments. The asterisk (*) indicates a significant difference (p < 0.01) between groups treated with delphinidin and the untreated control group. B, (left panel) Delphinidin inhibits EGF-induced cell transformation. JB6 P+ cells were treated as described in “Materials and Methods”, and colonies were counted 14 days later: (a) untreated control; (b) EGF alone; (c) EGF and 5 μM delphinidin; (d) EGF and 10 μM delphinidin; (e) EGF and 20 μM delphinidin; and (f) EGF and 40 μM delphinidin. (right panel) Cell colonies were counted under a microscope with the aid of Image-Pro Plus software. The effects of delphinidin on cell transformation of JB6 P+ cells are presented as the percent inhibition of cell transformation in soft agar relative to cell stimulated by only EGF. Data are presented as mean and S.D. values from three independent experiments. The asterisk (*) indicates a significant difference (p < 0.01) between groups treated with EGF and delphinidin and the group treated with EGF alone. C, Delphinidin inhibits TPA-induced neoplastic transformation by directly targeting Raf1 and MEK1 activities. The “+” indicates a greater inhibition of kinase activity. D, Modeling study of the binding of delphinidin to Raf1 or MEK1. Upper panel, Hypothetical model of the B-Raf–ATP–delphinidin complex. Delphinidin (with green carbon atoms) binds to the pocket adjacent to the ATP (white carbon atoms)-binding site. BAY43-9006 (yellow) is overlaid on the model structure. The partially disordered activation loop is colored white. The residues involved in the interactions with delphinidin are indicated. The hydrogen bond is depicted as a dashed line. Lower panel, Hypothetical model of the MEK1–ATP–delphinidin complex. Delphinidin (atomic color) binds to the pocket adjacent to the ATP (orange)-binding site. PD318088 (green) is overlaid on the model structure of the complex for comparison. The partially disordered activation loop is colored yellow. The residues involved in the interactions with delphinidin are indicated. The hydrogen bond is depicted as a dashed line.