
Fig. 4.
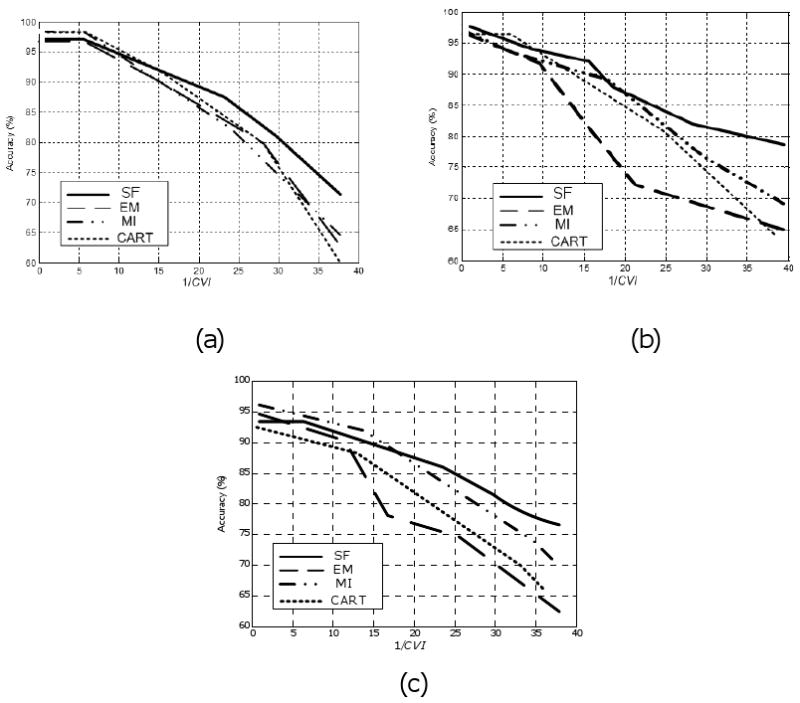
Performance of missing value management methods versus cluster validity index: (a)-(c) the results of the UCI Breast Cancer and Pima Diabet datasets, and the human brain image database system (HBIDS), respectively (refer to Table 1). The selection-fusion (SF), expectation maximization (EM), multiple imputations (MI), and CART methods are compared. 1/CVI increases as the percentage of missing values increases. Note the overall superiority of the SF method especially when 1/CVI is large.