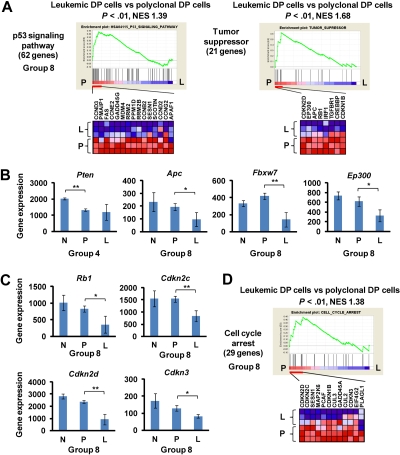
Figure 3.
Down-regulation of tumor suppressors and cell cycle regulators at the late phase of leukemogenesis. (A) GSEA histograms for the gene sets “p53 signaling pathway” and “tumor suppressor.” See Figure 2A description for details on the GSEA histogram. The NES and the nominal P value are indicated. Normal control (N), polyclonal DP cells (P), and leukemic DP cells (L). (B) Expression of Pten, Apc, Fbxw7, and Ep300 at the normal (control), polyclonal DP cells, and leukemic DP cells. Significance was evaluated by the Student t test: *P < .05, **P < .01. Data are mean ± SD values of triplicate experiments. (C) Expression levels of the cell cycle regulators Rb1, Cdkn2c, Cdkn2d, and Cdkn3. Significance was evaluated by the Student t test: *P < .05, **P < .01. Data are mean ± SD values of triplicate experiments. (D) GSEA histogram for the gene set “cell cycle arrest.”

