Figure 5.
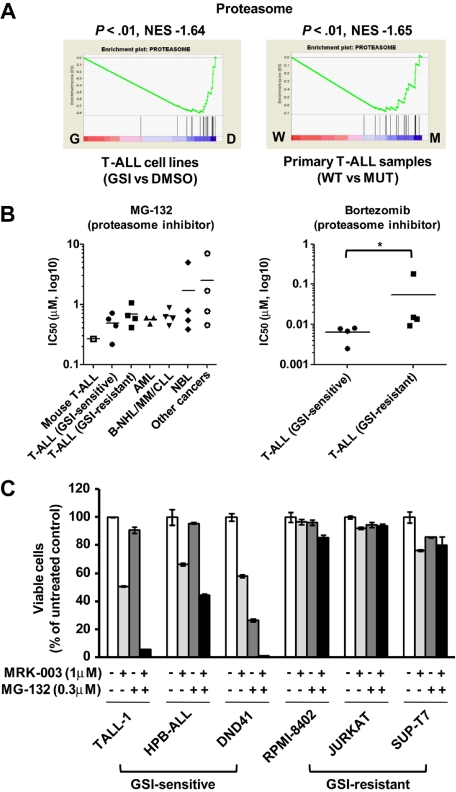
Up-regulation of proteasome pathway and the growth inhibitory effect of proteasome inhibitors on T-ALL cells. (A) GSEA histograms for human T-ALL cells (cell lines or primary clinical samples) representing the “proteasome pathway.” The NES and the nominal P value are indicated. GSI-treated T-ALL cell lines (G), DMSO-treated T-ALL cell lines (D), wild-type primary T-ALL samples (W), and NOTCH1-mutant primary samples (M). (B) IC50 values with the proteasome inhibitors MG-132 and bortezomib. Mouse leukemic DP cells (mouse T-ALL) were obtained from the mouse after 8 weeks after transplantation of Lin− hematopoietic cells that had been transduced with the ICN1 gene. Mouse T-ALL cells and various types of human leukemia/cancer cell lines were treated for 3 days with a proteasome inhibitor MG-132 (1 mouse T-ALL, 4 GSI-sensitive T-ALL, 4 GSI-resistant T-ALL, 3 acute myeloid leukemia [AML], 4 B-cell non-Hodgkin lymphoma [B-NHL]/multiple myeloma [MM]/chronic lymphocytic leukemia [CLL], 4 neuroblastoma [NBL], and 4 other cancer cell lines) or bortezomib (4 GSI-sensitive T-ALL and 4 GSI-resistant T-ALL). The number of viable cells was measured by the MTT assay, and the IC50 values were calculated for each cell. (C) Synergistic effect of MG-132 in combination with GSI. Three GSI-sensitive and 3 GSI-resistant T-ALL cell lines were treated with or without MG-132 (0.3μM) in the presence or absence of GSI MRK-003 (1μM) for 6 days. The number of viable cells was measured by the MTT assay.

