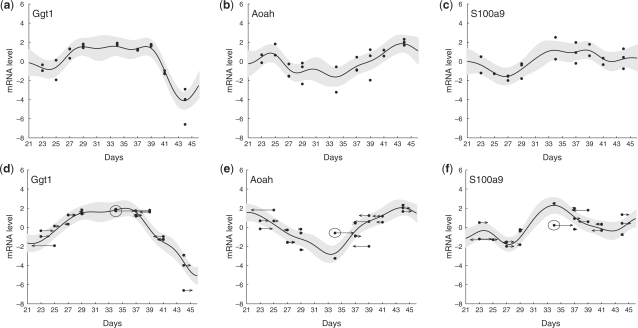
Fig. 3.
Examples of curve fitting using GPR with time shifts. The dots represent the gene expression of the replicates at their nominal time. Their time shifts are shown by arrows, whose end points indicate the shifted data. Curves show the estimated gene expression profiles, with pointwise 95% confidence intervals shaded. Here, we use στ=1. (a–c), Curves fit to genes Ggt1, Pixna1 and S100a9 using GPR without time shifts. The estimated GP parameters are l=2.15, σn=0.41, σf=0.75. (d–f), The same genes as (a–c), including time shifts. The estimated GP parameters are l=2.50, σn=0.33, σf=0.86. Replicate 34-1 is circled for emphasis; its time shift in (e) and (f) greatly improves the apparent fit.

