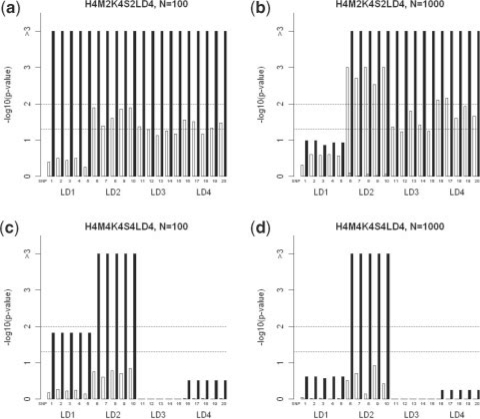
Fig. 3.
Empirical P-values of risk SNPs and SNPs in LD with them in models H4M2K2S2LD4 and H4M4K4S2LD4. White, grey and black bars represent the permutation importance, Gini importance, and MCC importance scores, respectively. Two dash lines represents the genome-wide significance level of 0.05 and 0.01, respectively.

