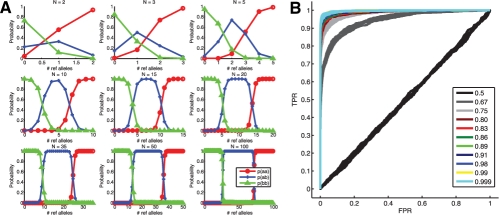
Fig. 2.
(A) Theoretical behavior of SNVmix at depths of 2, 3, 5, 10, 15, 20, 35, 50 and 100. The plots show how the distribution of marginal probabilities changes with the number of reference alleles given the model parameters fit to a 10× breast cancer genome dataset. (B) ROC curves from fitting SNVMix2 to synthetic data with increasing levels of certainty in the base call.

