
Figure 4.
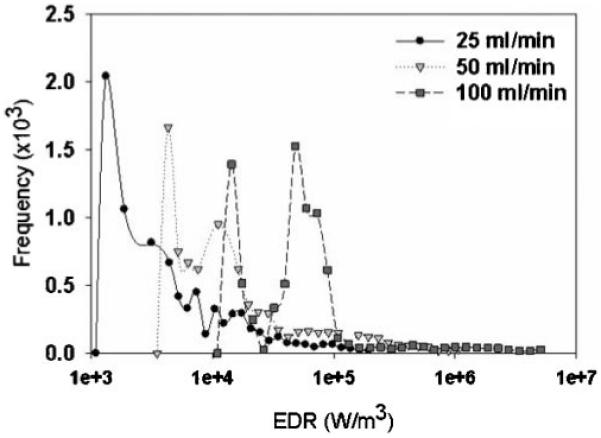
Log-bin histogram of the maximum EDR that each simulated particle experienced as it flowed through the TC at a flow rate of 25, 50, and 100 mL/min.
Official websites use .gov
A
.gov website belongs to an official
government organization in the United States.
Secure .gov websites use HTTPS
A lock (
) or https:// means you've safely
connected to the .gov website. Share sensitive
information only on official, secure websites.
Log-bin histogram of the maximum EDR that each simulated particle experienced as it flowed through the TC at a flow rate of 25, 50, and 100 mL/min.