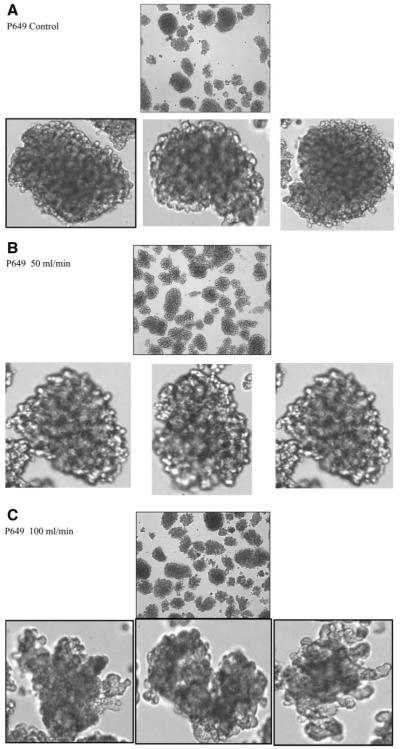
Figure 7.
Photographs of the islets from donor P649, before (A) and after flowing through the TC at 50 and 100 mL/min (B, C). For each of these conditions the photos at top photo show the general state of the islets; the lower photos are enlargements of a particular islet. The morphology of the islets exposed to the 100 mL/min flow through the TC is clearly more rough on the edges, and in one case, the islets are partially split into two parts. Visual inspection of the 50 mL/min in (B) and (C) indicates that this “roughing” of the edges is beginning.

