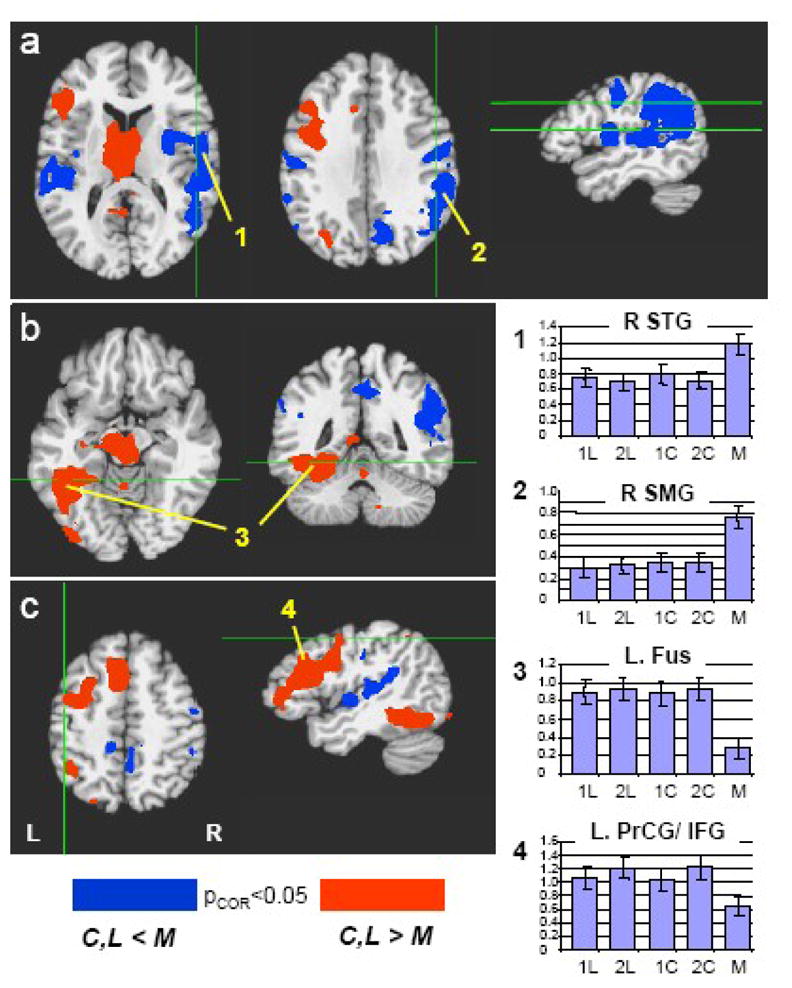
Figure 1.

Category and letter fluency tasks (C,L) vs. “Months” automatic speech control condition (M). Blue areas indicate regions with a greater activation during the automatic speech; Red areas indicate regions with a greater activation during the fluency tasks. Activations are thresholded at p<0.05 (corrected for multiple comparisons). Bar graphs on right indicate the average signal intensity during each of the 5 tasks, averaged over all subjects and over the region of interest indicated by the number (1–4). (R.STG = Right Superior Temporal Gyrus, R.SMG = Right Supramarginal Gyrus, L.Fus = Left Fusiform Gyrus, L.PrCG/IFG = Left Precentral Gyrus/Inferior Frontal Gyrus.) Note that activation associated with automatic speech is greater in the right hemisphere, whereas activation associated with the fluency tasks is left hemisphere lateralized.
