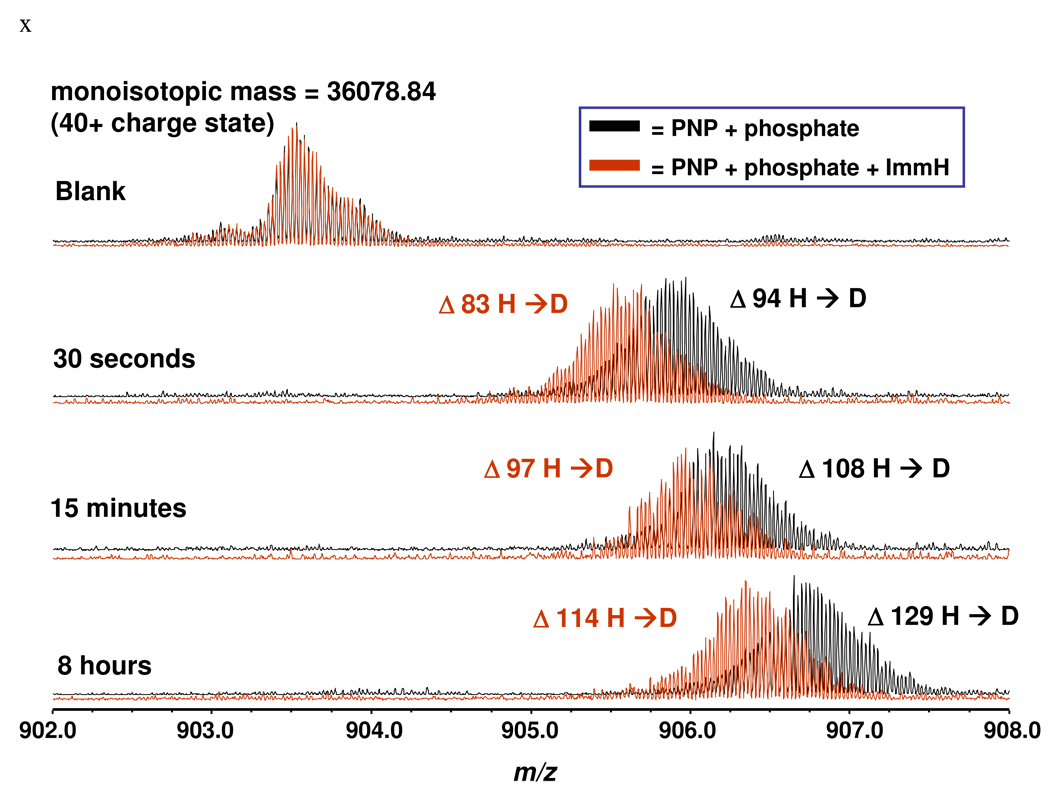
FIGURE 2.
Comparison of deuterium incorporation into PNP complexes monitored over an 8 hour time period. PNP•PO4 (black spectra); PNP•PO4•ImmH (red spectra). At each time interval more deuterium is incorporated into the PNP•PO4 complex than in the PNP•PO4•ImmH complex. The Blank compares the complexes prior to addition of D2O. In the ms, PNP subunits dissociate and the inhibitor ligands are lost. Thus, the calculated mass (36,101 amu) is close to the determined mass (36,079 amu) and no mass for inhibitor or phosphate is observed. The ImmH concentration gives >97% of catalytic site saturation under these conditions.

