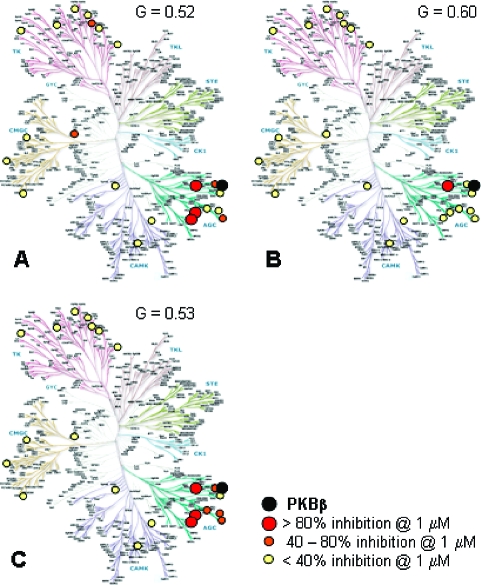
Figure 3.
Selectivity profiles and Gini coefficients(28) (G) of 2 (A), 10 (B), and 21 (C) against a panel of 22 human kinases, measured at 1 μM concentration of the test compound. Kinase dendrogram(29) reproduced courtesy of Cell SignalingTechnology, Inc. (www.cellsignal.com).

