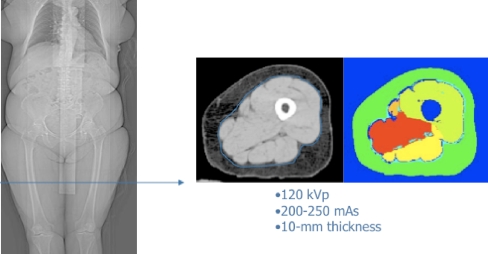
Fig. 4.
CT acquisition through midthigh. Location of axial section is shown on localizer image at the left, with corresponding axial image in the middle and segmentation into distinct tissue compartments at the right. Green: subcutaneous fat. Olive: quadriceps muscle. Yellow: hamstrings muscle. Red: adductor muscles. Orange: sartorius muscle

