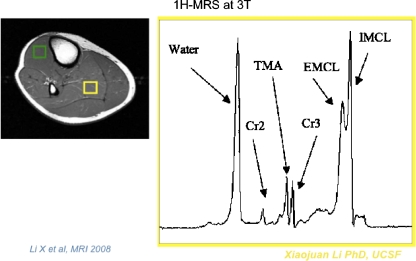
Fig. 5.
MRI image of calf at the right, with green and yellow boxes indicating locations of spectroscopic acquisitions of the tibialis anterior and soleus muscles, respectively. Proton spectroscopy studies may be used to assess the relative amounts of intramyocellular and extramyocellular lipid. At the right, a proton spectrum corresponding to the soleus muscle shows 1H resonances associated with creatinine (CR2 and CR3), water, extramyocellular lipid (EMCL), intramyocellular lipid (IMCL), and trimethylamines (TMA)

