
Figure 2. Expression pattern of M3R.
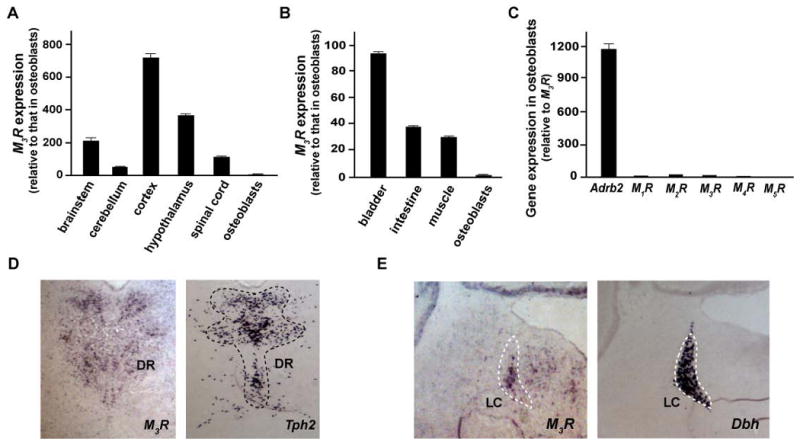
(A-C) Gene expression by real-time quantitative PCR (qPCR) analysis. Comparison of M3R expression between osteoblasts, various regions of the brain (A) and several peripheral tissues (B). (C) Gene expression of M1R, M2R, M3R, M4R and M5R in osteoblasts compared to that of Adrb2. The osteoblasts used were primary osteoblast cultures with 5-day induction for differentiation. (D and E) In situ mRNA hybridization analysis of M3R expression in brain. Tph2 and Dbh are the molecular markers of the Dorsal Raphe (DR) and Locus Coeruleus (LC) nuclei respectively.