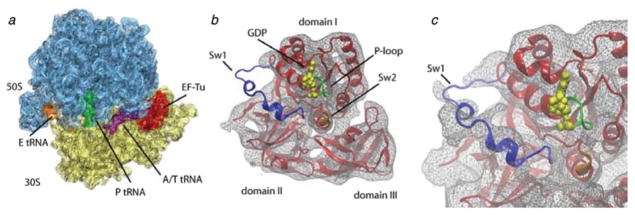
Fig. 7.
GTP hydrolysis on EF-Tu. (a) Cryo-EM map of the 70S•fMet-tRNAfMet•Phe-tRNAPhe•EF-TuGDP•kir complex. Cryo-EM densities are shown for the small (yellow) and large (blue) subunits, A-, P-, and E-site tRNAs (magenta green and orange, respectively), and EF-Tu (red) as transparent surface, along with the atomic model (shown in cartoon representation) obtained by flexible fitting using MDFF. (b) Switch regions in the MDFF-generated atomic model of ribosome-bound EF-Tu: Switch I (Sw1, blue), Switch II (Sw2, orange), and P-loop (green). (c) Close-up of the GTPase domain of EF-Tu. The cryo-EM density map is displayed at a lower threshold compared to that in panel (b) (1·4σ versus 2·2σ) to make the Switch I density visible. Data reproduced from Villa et al. (2009a), copyright (2009) National Academy of Sciences.

