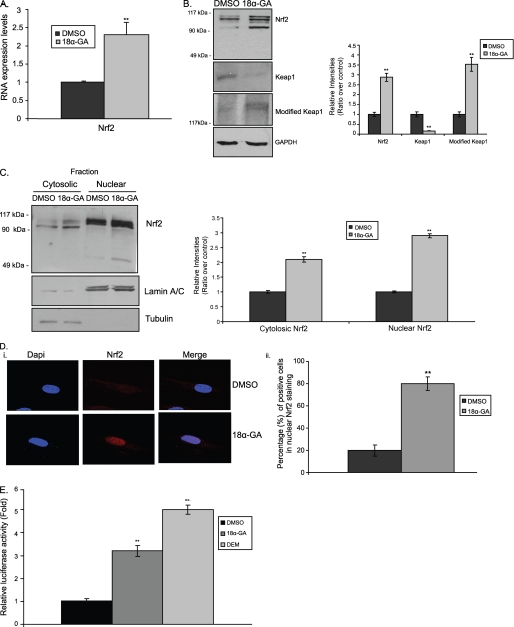
FIGURE 2.
Activation of Nrf2 by 18α-GA. A, quantification of RNA expression levels of Nrf2 in HFL-1 cells treated with 2 μg/ml of 18α-GA or DMSO for 2 h. Nrf2 RNA expression levels in DMSO-treated cells were arbitrary set to 1. B, immunoblot analysis of Nrf2, Keap1, and modified Keap1 and the relative quantification in HFL-1 cells treated with 2 μg/ml of 18α-GA or DMSO for 2 h. GAPDH levels were used as loading control. C, cell fractionation and relative quantification of Nrf2 in HFL-1 cells treated with 2 μg/ml of 18α-GA or DMSO for 2 h. Lower exposure of the Nrf2 immunoblot to show the specific Nrf2 bands is included in supplemental Fig. 1D, iii. Tubulin and lamin A/C were used as markers of cytosolic and nuclear fractions, respectively. D, panel i, Nrf2 localization analyzed by confocal microscopy; and panel ii, percentage of cells with nuclear Nrf2 accumulation, in HFL-1 cells treated with 2 μg/ml of 18α-GA or DMSO for 2 h. 4′,6-Diamidino-2-phenylindole (DAPI) was used as a marker for nucleus visualization. E, luciferase activity in HFL-1 cells transfected with the pTi-ARE-Luc construct and treated with 2 μg/ml of 18α-GA or DMSO for 2 h. Treatment with DEM for 24 h was used as positive control. Luciferase activity in DMSO-treated cells was arbitrary set to 1. Molecular mass markers in B and C are indicated on the left side of the Nrf2 and modified Keap1 blots. All values are reported as mean of three independent experiments ± S.D. Statistical significance at p < 0.01 is denoted by double asterisks.

