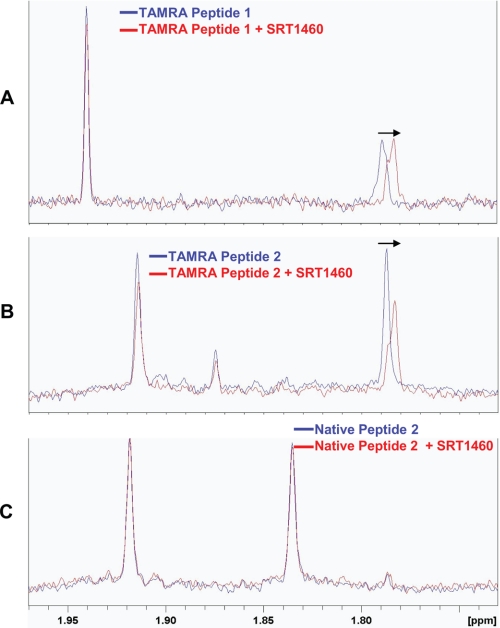
FIGURE 6.
NMR chemical shift perturbation studies of SRT1460 with p53-derived peptide substrates in the absence of SIRT1. A, 1H NMR spectrum of 10 μm of the TAMRA Peptide 1 (supplemental Table S1) in the presence (red) or absence (blue) of 50 μm SRT1460. B, 1H NMR spectrum of 10 μm of TAMRA Peptide 2 in the presence (red) or absence (blue) of 50 μm SRT1460. C, 1H NMR spectrum of 10 μm of the Native Peptide 2 in the presence (red) or absence (blue) of 50 μm SRT1460. Arrows indicate the upfield shift of the acetyl (CH3) signal at 1.78 ppm in A and B (blue) upon the addition of 50 μm SRT1460 (red), whereas the acetyl (CH3) signal at 1.83 ppm in C showed no shift (blue and red) upon the addition of 50 μm SRT1460. The amino acid sequence of the TAMRA Peptide 2 and the Native Peptide 2 are identical and differ only in the TAMRA group (supplemental Table S1).

