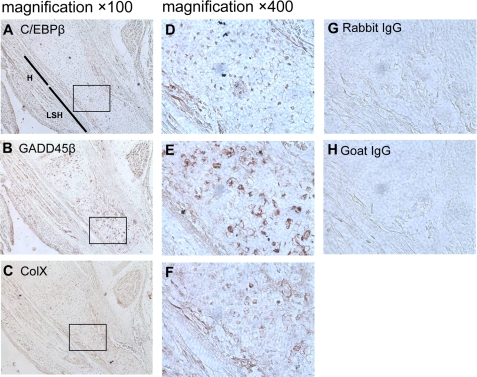
FIGURE 2.
C/EBPβ distribution in mouse embryonic growth plates. Embryonic growth plates of left limbs (embryonic day 15.5) were stained using antibodies against C/EBPβ (A and D), GADD45β (B and E), collagen X (C and F), and control rabbit (G) and goat (H) IgG, as described under “Experimental Procedures.” The boxes in A–C designate the areas magnified in D–F, showing the late stage hypertrophic (LSH) zone marked with a line in A, compared with the hypertrophic (H) zone. Original magnifications were ×100 (A–C) and ×400 (D–H).

