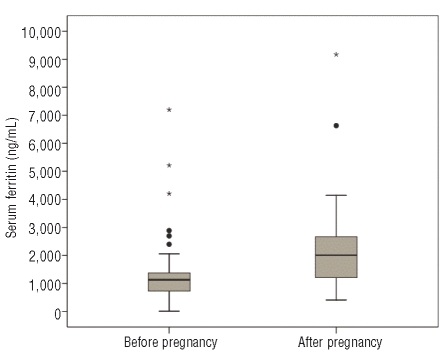
Figure 3.
Serum ferritin levels before and after pregnancy. The box plot shows the median values as the lines inside the boxes, Tukey’s hinges as the box’ boundaries, and interquartile range (IQR) as the length of the boxes. Values more than 1.5 IQR from the end of the box are represented by dots while values more than three IQR from the end of the box are represented by asterisks.

