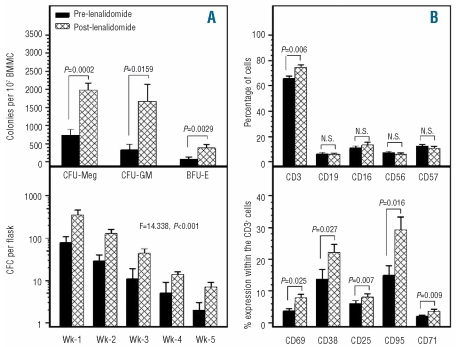
Figure 3.
BM clonogenic progenitor cells and peripheral blood lymphocyte subsets before and after lenalidomide therapy. (A) The bars in the upper graph represent the mean number (±SEM) of CFU-Meg, CFU-GM and BFU-E colonies obtained from 107 BMMC. The bars in the lower graph represent the mean CFC numbers (±SEM) in LTBMC supernatants over 5 weeks of culture, before and after therapy. Results were compared using Student’s t test for paired samples (upper graph) and 2-way ANOVA (lower graph) and the P and F values are indicated. (B) The bars in graph B represent the mean proportion (±SEM) of PB lymphocyte subpopulations (upper panel) and the mean percentage of cells expressing markers of activation within the CD3+ cell fraction (lower panel), before and after therapy. Results were compared using Student’s t test for paired samples and P values are shown. SEM; standard error of the mean.

