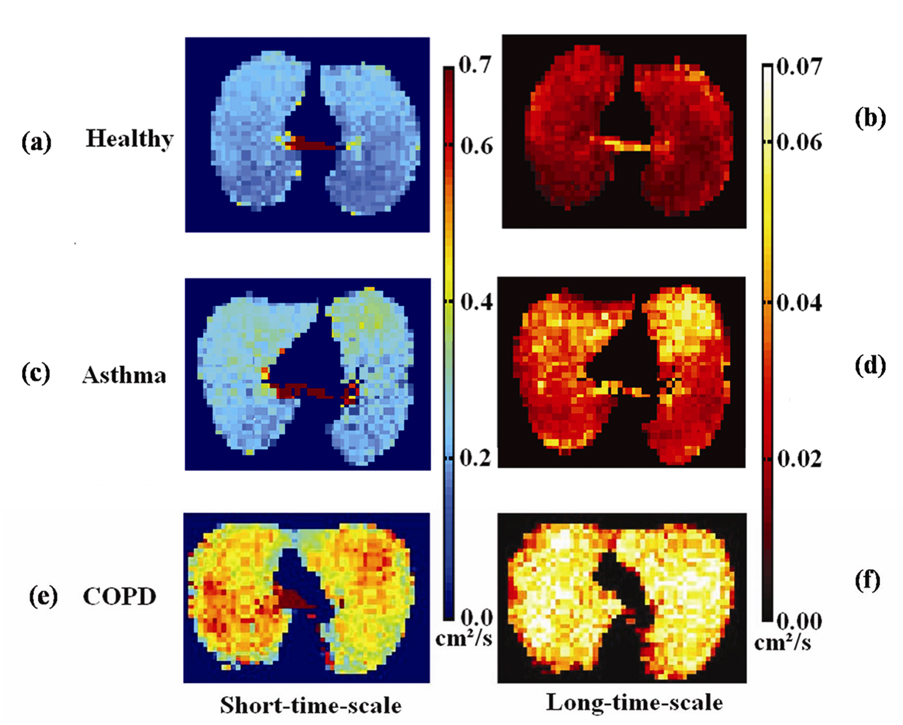
Figure 1.
Co-registered axial ADC maps from: healthy subject #7 at diffusion times of (a) 1 ms and (b) 1.5 s; asthma subject # 6 at diffusion times of (c) 1 ms and (d) 1.5 s; and COPD subject #1 at diffusion times of (e) 1 ms and (f) 1.5 s. The healthy subject has homogeneously low ADC values at both time scales. The asthmatic has focal areas of elevated ADC values anteriorly that are larger and more conspicuous on the long-time-scale ADC maps. The subject with COPD has diffusely, markedly elevated ADC values.

