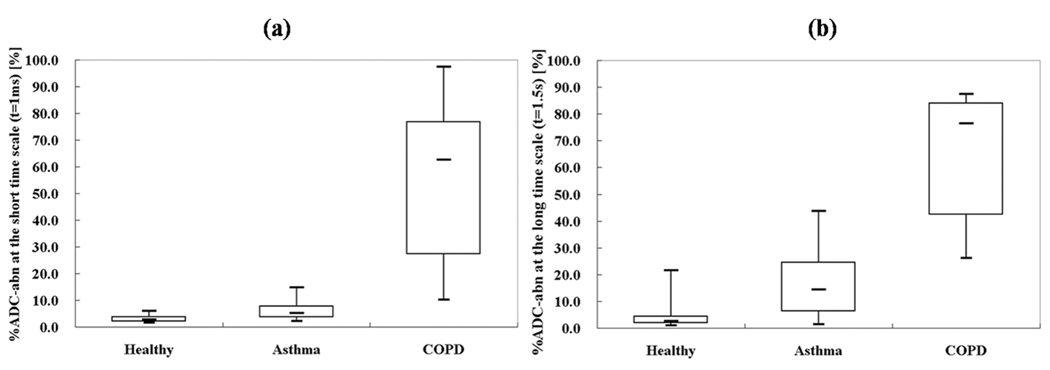
Figure 3.
Box plot of %ADC-abn values from each subject group for (a) the short-time scale (t = 1 ms) and (b) the long-time scale (t = 1.5 s). The three groups are better separated on the long-time-scale %ADC-abn (Short-time-scale: Pasthma-healthy = 0.004; PCOPD-healthy < 0.001; PCOPD-asthma = 0.001. Long-time-scale: Pasthma-healthy = 0.006; PCOPD-healthy < 0.001; PCOPD-asthma < 0.001.). The figure notation is the same as in Fig. 2.

