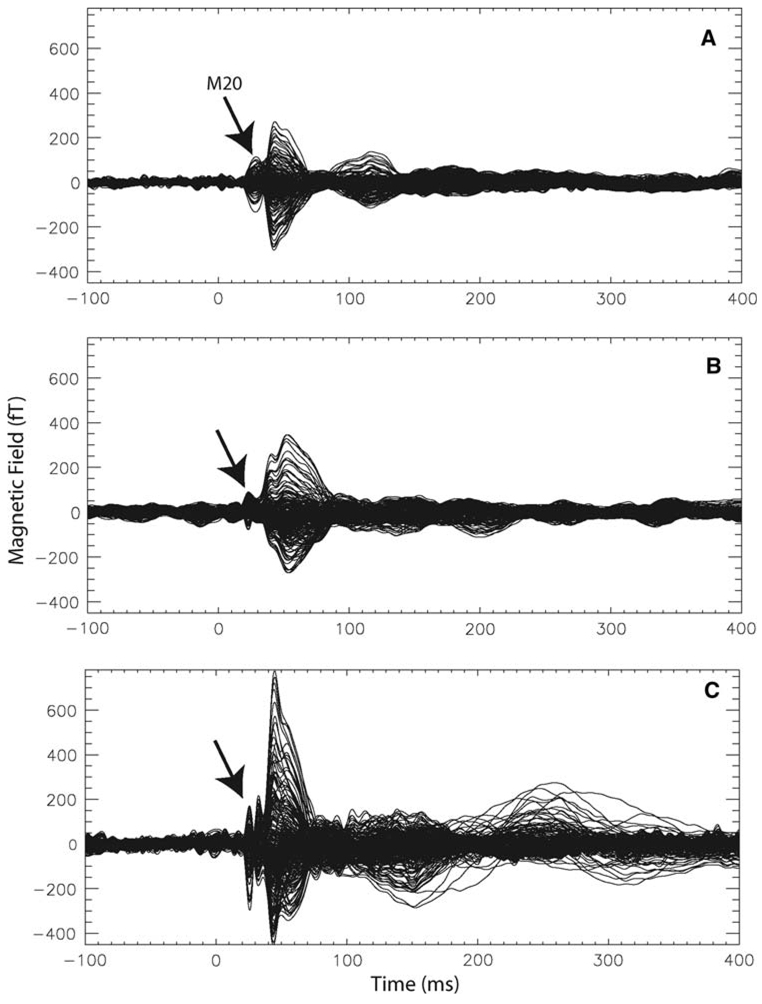
Fig. 1.
Example waveforms. The waveform responses to left median nerve stimulation are shown for three individuals. All channels from the 275-channel array system are plotted on one axis to reveal the timing and amplitudes associated with the responses. A clear M20 is visible in all three participants as is expected from median nerve stimulation. a A sample waveform for a NE female participant. b A sample waveform from a NE male participant. c A sample waveform from a male MCI participant. Notice the larger amplitude response. These waveforms are consistent with the results seen across participant groups in the SI timecourses shown in Fig. 2

