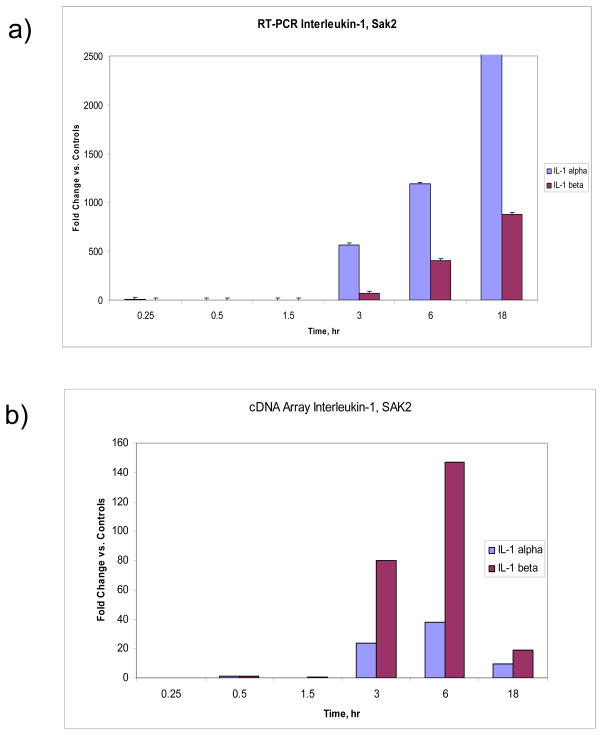
Figure 11.
a) Expression levels of Interleukin-1 α and β, detected using LSDGE, showing almost identical up regulation patterns at late time points only, b) Expression levels of Interleukin-1 α and β, detected using semi-quantitative real time RT-PCR, showing similar up regulation patterns confined to the late time points, but differing in dynamic range to the cDNA data. All data were normalized by comparing to 18s RNA, then to controls, and fold changes quantified using the Δ ΔCt method (see Materials & Methods) For data shown in a) error bars represent ±S.E.M. For a) and b) all genes shown are p<0.05 or smaller, as compared to controls.

