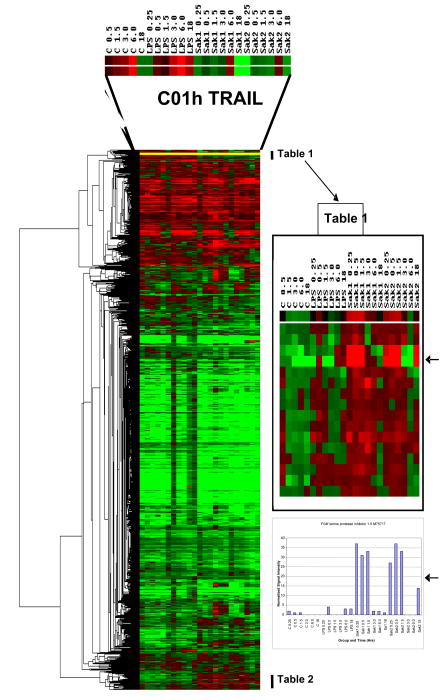
Figure 3.
Dendrogram and heat map generated by clustering (hierarchical, uncentered) of all sample data expressed as a ratio of the respective 0.25 h control (untreated murine macrophage J774 cellular mRNA) time point, using Eisen software [38]. Red indicates up regulation and green down regulation. The group of transcripts at the top of the figure exhibit up regulation for each treatment group which is more clearly shown in the form of normalized signal intensity data; the example of TRAIL is shown in Figure 4A. Gene lists for selected regions of the heat map are shown in Tables 1 and 2. These genes were enlarged to show differences between CpG/non-CpG and control or LPS/IFN-γ. The rows of colored squares in the enlarged inset are listed on Tables 1 in order from top to bottom and similarly for genes of Table 2 that are indicated on the large heat map. The arrows on the right-hand side highlight a comparison between the ratio and the normalized signal intensity data set for SPI 1–5, which is a good example of a gene shared by non-CpG and CpG, but differing from control and LPS/IFN-γ.

