
Figure 5. Multiple paternity rates and social mating system.
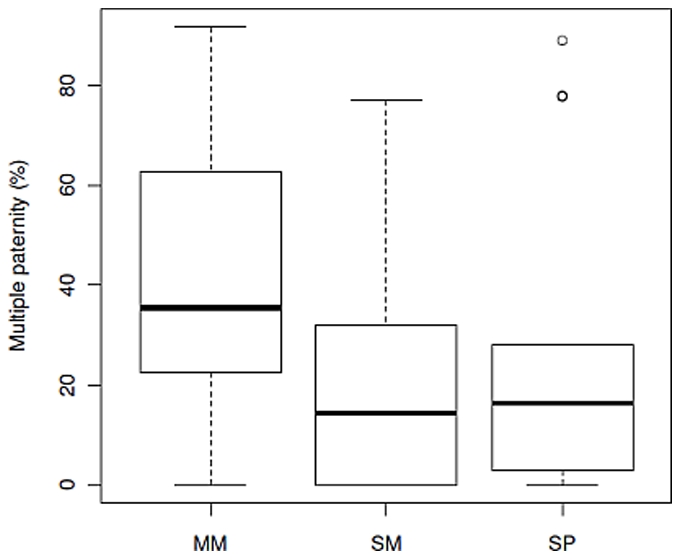
SM: socially monogamous; SP: socially polygynous; MM: multi-male. Multiple paternity rates differed significantly between social mating systems (F 2,61 = 4.58 P = 0.014); SM was significantly different from MM species (Tukey HSD = 0.036), but not SP species (Tukey HSD = 0.839). MM and SP species did not differ significantly (Tukey HSD = 0.079).