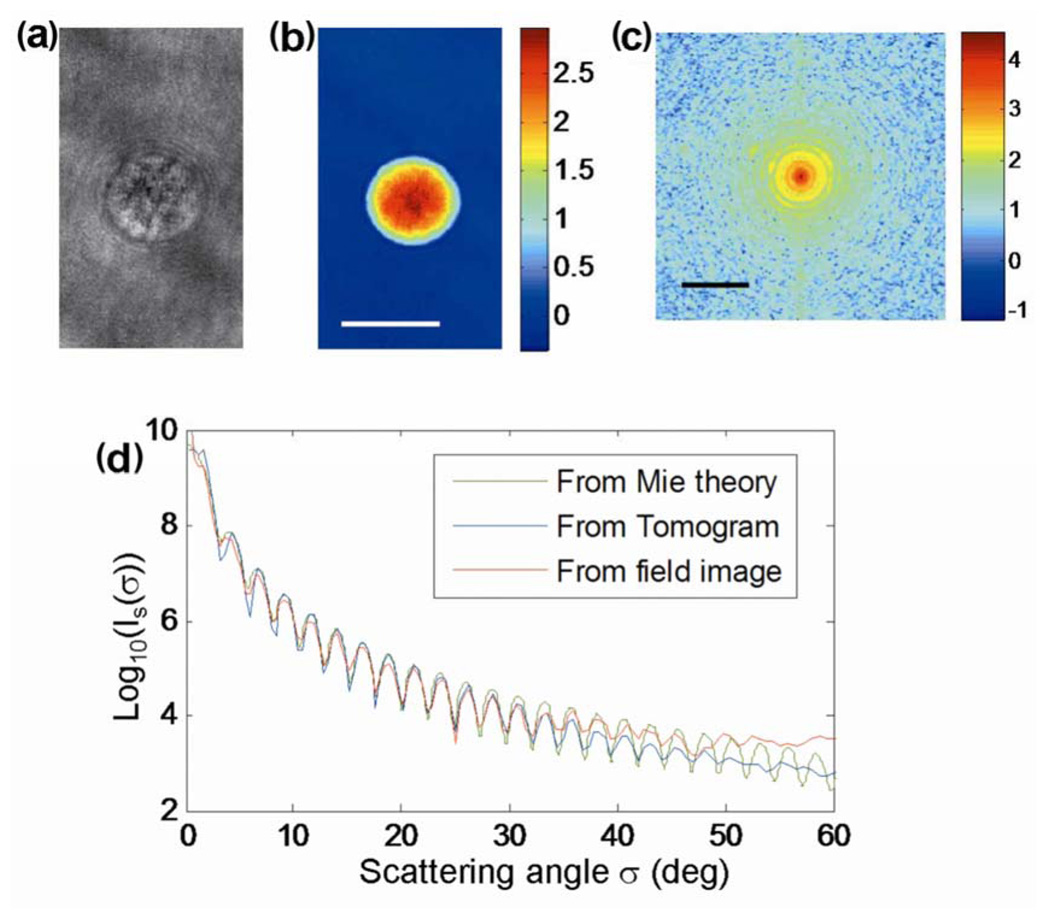
Fig. 2.
(Color online) Angular distribution of light scattering for a 10 µm polystyrene bead: (a) amplitude image of the bead, (b) quantitative phase image of the bead (the scale bar indicates 10 µm, and the color bar indicates the phase in radians); (c) angular scattering distribution, |Ẽ(νx , νy)|2 (the 1 µm−1 scale indicates the base-10 logarithm of the intensity); and (d) angular scattering distribution obtained from Mie theory (dashed-dotted curve), tomogram (dotted curve) and field image (solid curve), respectively.

