Fig. 4.

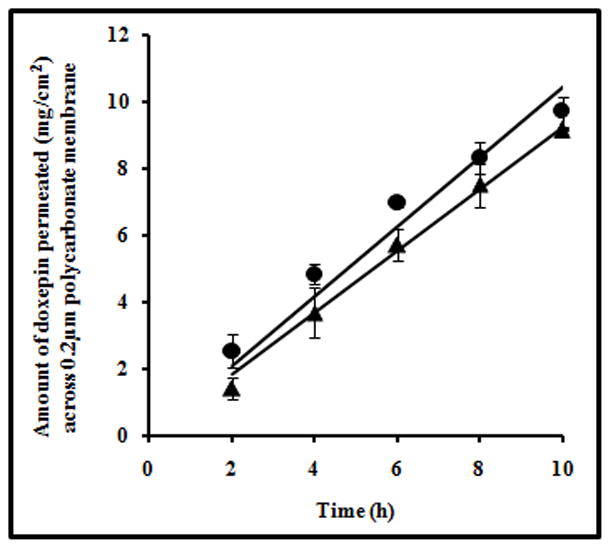
Plot showing the amount of drug permeated at different time points from PDS (●) and CDS (▲) across 0.2μm pore size polycarbonate membrane. The data points are average of n=3±S.D.

Plot showing the amount of drug permeated at different time points from PDS (●) and CDS (▲) across 0.2μm pore size polycarbonate membrane. The data points are average of n=3±S.D.