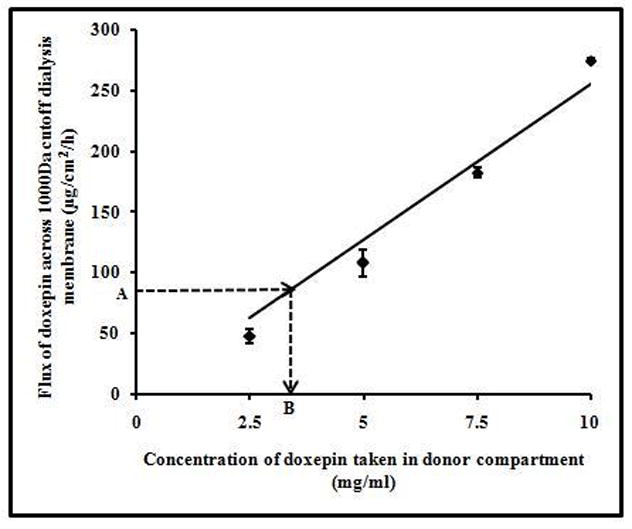
Fig. 5.

Flux of doxepin from different concentrations of PDS across 1000Da molecular weight cut off dialysis membrane. There was a linear relationship (y=25.48x; R2=0.96) between the donor concentrations of PDS and doxepin flux. Point A (~82μg/cm2/h) is the flux of doxepin from CDS across dialysis membrane. Point B (~3.2mg/ml) indicates the amount of free doxepin present in CDS in the donor. The data points are average of n=3±S.D.
