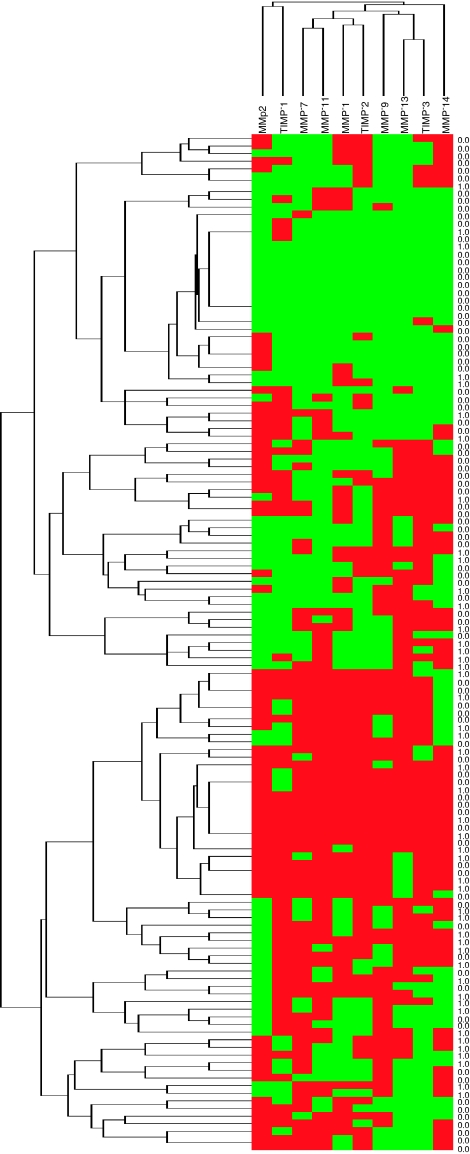
Figure 4.
Graphical representation of two-dimensional unsupervised hierarchical clustering results based on immunohistochemistry expression profiles of 10 proteins in 150 prostate carcinoma samples. Rows: samples; columns: proteins. Protein expression scores are depicted according to a colour scale: red: positive staining; green: negative staining; grey: missing data. Dendogram of samples (to the left of matrix) and proteins (above matrix) represent overall similarities in expression profiles. The status column: 1=with recurrence; 0=without recurrence, at the census point. Two major clusters of tumours (1 and 2) are shown for score values and in tumoural cells. The colour reproduction of the figure is avilable on the html full text version of the paper.

