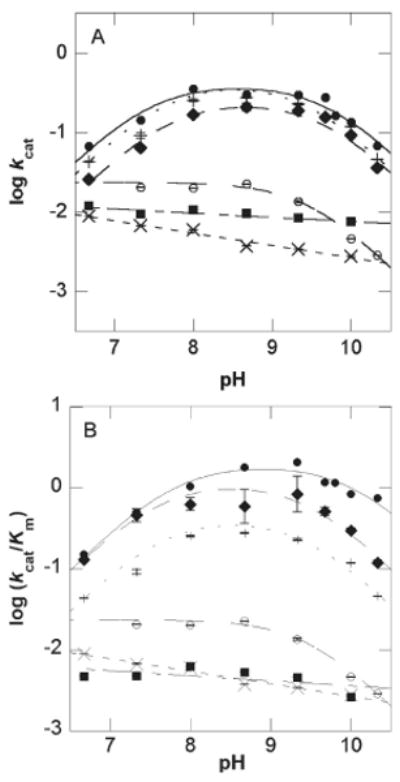
Figure 3.

pH dependence of kcat and kcat/Km for wild-type CPS (12) and the active site mutants. Plot of (A) log kcat versus pH and (B) log (kcat/Km) versus pH for wild-type CPS (●), Y345F (◆), Y345A (■), E380D (+), E380Q (○), and E380A (×). Error bars are shown and do not exceed the size of the data points when not visible.
