
Fig. 3.
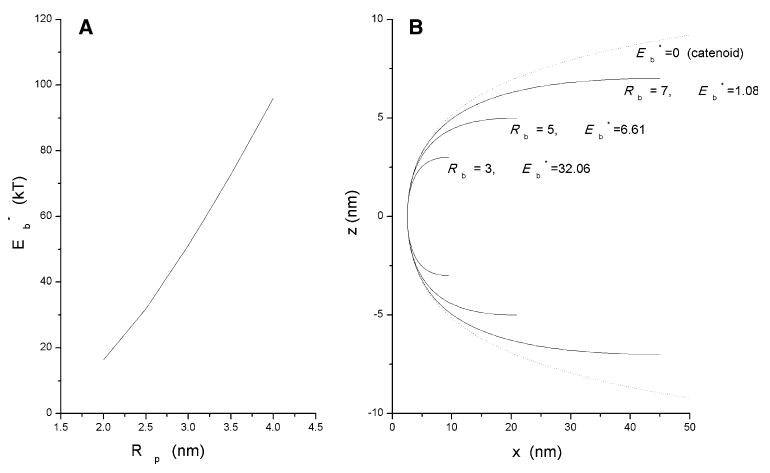
a Plots of fusion pore energy (Eb*) vs. fusion pore radius (Rp) for a single-contour bilayer. was obtained by minimizing Eq. 9 with Rn(s) represented as a polynomial (Eq. 12) of third order. b Shapes of curves that minimize (Eq. 9) for Rb = 3, 5 and 7 nm (Rp = 2.5 nm, C0 = 0). The larger values of Rb led to lower values of . The dashed curve is a catenary fitted by eye around the largest energy-minimized fusion pore. Note that the x- and z-axes have different scales in b