
Fig. 8.
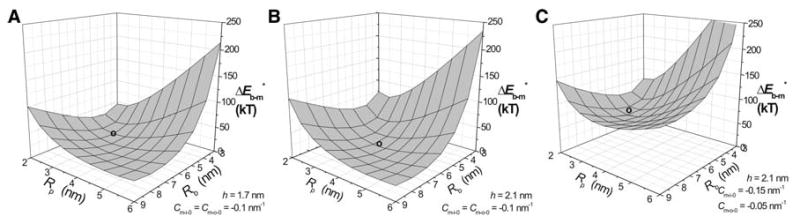
was determined for a range of values of Rp and Rb and plotted as an energy surface for these two parameters. Cm-i-0 = Cm-o-0 = −0.1 nm−1 for a and b and Cm-i-0 = −0.15 nm−1, Cm-o-0 = −0.05 nm−1 for c. h = 1.7 nm for a and 2.1 nm for b and c. The symbol o marks the local energy minimum of 12.97 kT at Rp = 3.3 nm and Rb = 5.45 nm (a), 11.54 kT at Rp = 3.8 nm and Rb = 6.05 nm (b) and 55.7 kT at Rp = 2.9 nm and Rb = 5.3 nm (c)