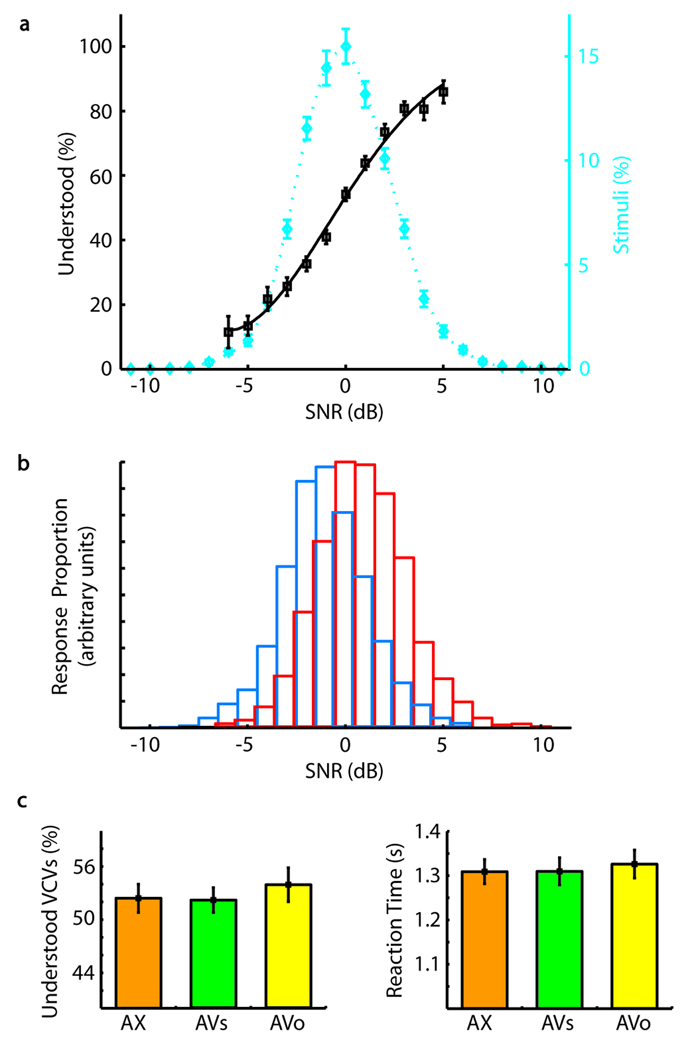
Figure 1.
Behavioral measures. (A) The mean percentage of understood responses (black squares) versus signal-to-noise ratio (SNR) is fit with a Weibull function (black, solid line). The likelihood of a subject understanding speech increases with increasing SNR. Additionally, a plot of the mean percentage of total stimuli versus SNR (blue diamonds) is fit with a smoothing spline function (blue, dotted line), revealing that most stimuli were presented within ±4 dB of threshold. SNR values are mean centered within subject, condition, and VCV. Axis label 0 dB corresponds to −4.71 dB relative to background babble. (B) Distribution of understood (red) and heard (blue) responses versus SNR. Overlapping regions are marked with blue and red edged boxes. Although sharply distinct perceptually, the SNRs of heard and understood speech show a high degree of overlap. (C) The mean percentage of understood responses and mean reaction times are plotted for the audio only (AX, orange), audiovisual synchronous (AVs, green), and audiovisual offset (AVo, yellow) stimulus conditions. Reaction times are relative to trial onset and are based on 24 subjects. All other panels are based on 25 subjects. Stimuli that did not elicit a response (i.e., misses) were not included in the stimulus count. Error bars reflect standard error.

