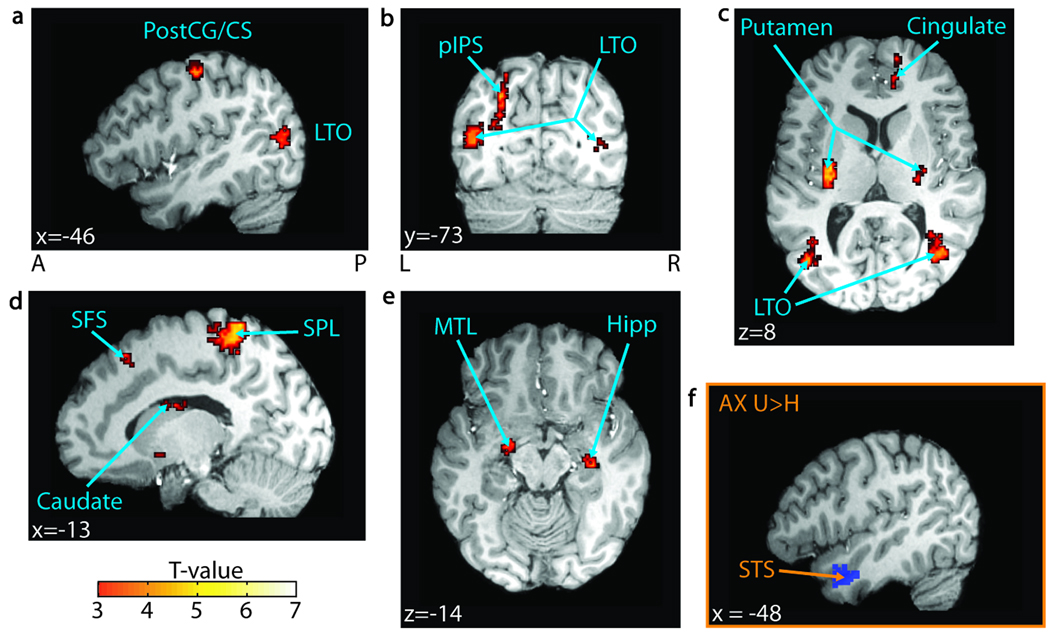
Figure 2.
Understanding versus hearing. (A–E) t Values for regions significant in a group-level t test for the understood > heard contrast across all conditions (FDR p< .05, n = 25) are overlaid on a representative brain. The significant regions include (A) the left postcentral gyrus (PostCG) and the central sulcus (CS); (B) the left posterior intraparietal sulcus (pIPS) and the bilateral lateral temporal–occipital boundary (LTO); (C) the bilateral putamen and the right anterior cingulate sulcus (Cingulate); (D) the left superior frontal sulcus (SFS), the left superior parietal lobule (SPL), and the left body of the caudate nucleus; and (E) the left medial temporal lobe (MTL) and the right hippocampus (Hipp). Additionally, the left superior temporal sulcus (STS) showed increased BOLD activity in the understood > heard contrast in the audio-only condition ( p < .005, n = 25). (F) The left STS seed region used in the connectivity analysis, defined by the understood > heard contrast in the audio-only condition ( p < .05, n = 25), is overlaid on a single subject’s brain. MNI coordinates are reported in white text in each panel. A = anterior; P = posterior; L = left; R = right.

