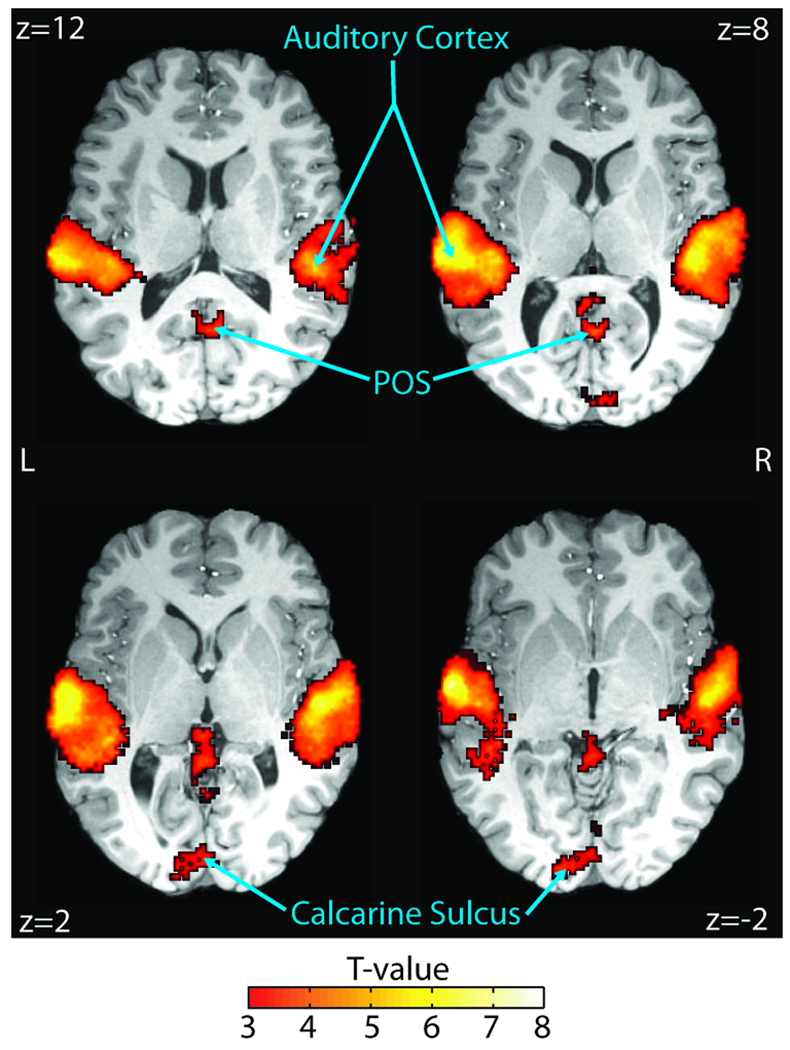
Figure 6.
Quantifying SNR sensitivity. Regions significant in a group-level t test of SNR regressor beta estimates (see Methods) are overlaid on a representative brain. The bilateral auditory cortex, including Heschl’s gyri, superior temporal gyri/sulci, and left middle temporal gyrus, were significantly sensitive (FDR p < .05, n = 25) to SNR (FDR p < .05, n = 25). Importantly, BOLD activity in our understanding network is not significantly explained by the small SNR variance. MNI coordinates are reported in white text in each panel. L = left; R = right.

