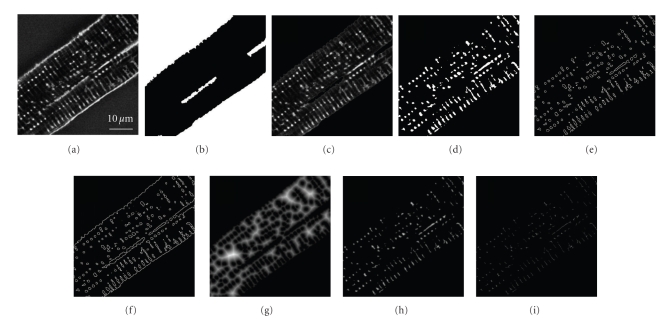
Figure 2.
Image Processing for the Analysis of Cellular Volumes, Surface Areas, and Euclidian Distance Maps. From the deconvoluted images (a), binary masks (b) of the cell borders were drawn. The interior of the myocyte (c) was thresholded (d), with bright areas representing the TATS. The images were transferred into outline maps with or without cell borders, to estimate the surface area of the TATS (e) and the total membrane area of the cardiomyocyte (f). Furthermore, thresholded images were 2-fold inflated and transferred into Euclidian distance maps to determine the distance from any pixel representing cytosol to its next neighboring membrane (g), and respectively, from any pixel representing TATS to the next neighboring cytosol (h). Finally, the Euclidian distance maps of the TATS were reduced to their 3D-reconstructed skeleton in order to analyze regional object diameters (i). All Distance maps (g)–(i) are shown here brightened up from 4- to 32-fold for improved illustration.

