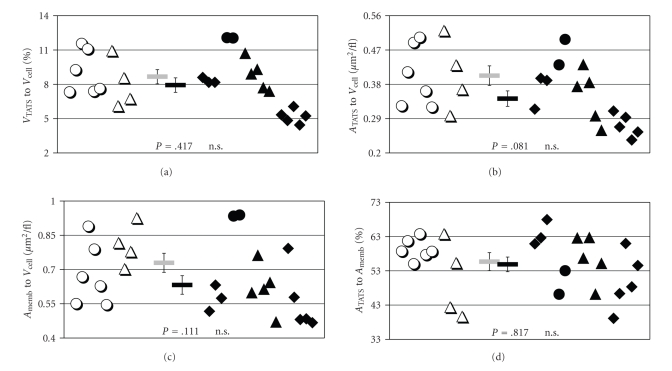
Figure 4.
Volume and Surface Dimensions of the Transverse-Axial Tubule System. TATS volume (“VTATS”, (a)), TATS surface area (“ATATS”, (b)) and total cell membrane area (“AMemb”, (c)) are shown to be normalized to cell volume (“VCell”). Also, TATS surface area is shown as the proportion to total cell membrane area (d). The results are given for all myocytes analyzed from non-failing (open symbols, n = 10, 2 hearts) and failing hearts (closed symbols, n = 15, 4 hearts). Different symbols denote different cell batches. Bar symbols in the middle of each chart indicate the mean values ± SEM. Calculated P-values as given.

