
Fig. 4.
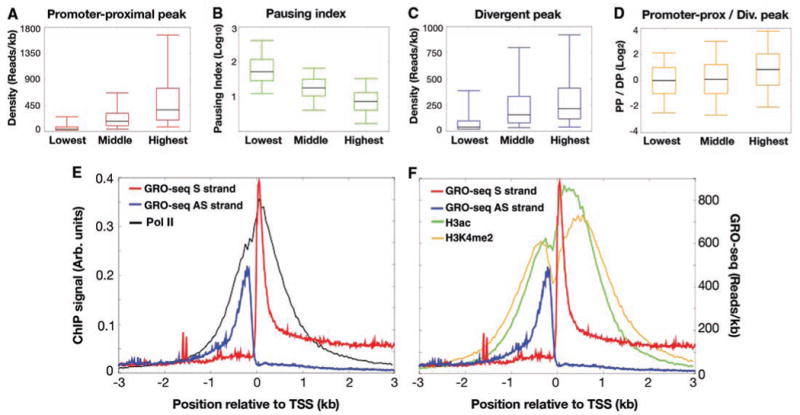
Correlation of promoter-proximal transcription patterns with gene activity. (A to D) Box plots (each showing the fifth, 25th, 50th, 75th, and 95th percentiles) that show the relationship of promoter-proximal (PP) sense peaks (red), divergent peaks (DP) (blue), pausing indices (green), and PP/DP ratios (orange) to the top, middle, and bottom deciles of gene activity. All deciles are significantly different from each other: P <10−9 for all comparisons except between the lowest and the middle deciles in (D) (P < 10−3). (E) ChIP profiles of Pol II and GRO-seq sense (S) and antisense (AS) strand reads aligned to TSSs. (F) ChIP profiles of H3ac and H3K4me2 and GRO-seq aligned to TSSs.