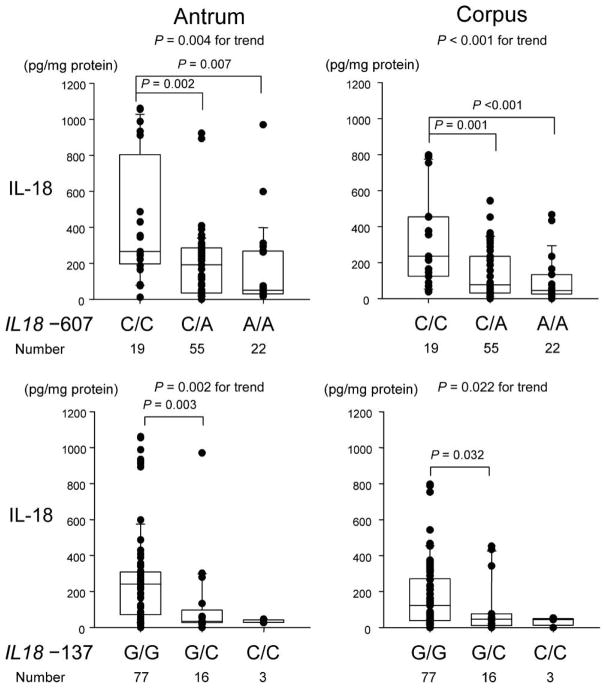
Figure 2.
Mucosal interleukin (IL)–18 levels in the antrum and the corpus in relation to the genotypes at IL18 –607 and –137. Each box shows the median (horizontal bar) and the 25th to the 75th percentile. Capped bars indicate the 10th and 90th percentiles. Data are also displayed using symbols. P values for comparisons between groups were calculated by the Kruskal-Wallis test along with the Scheffe multiple-comparison test.

