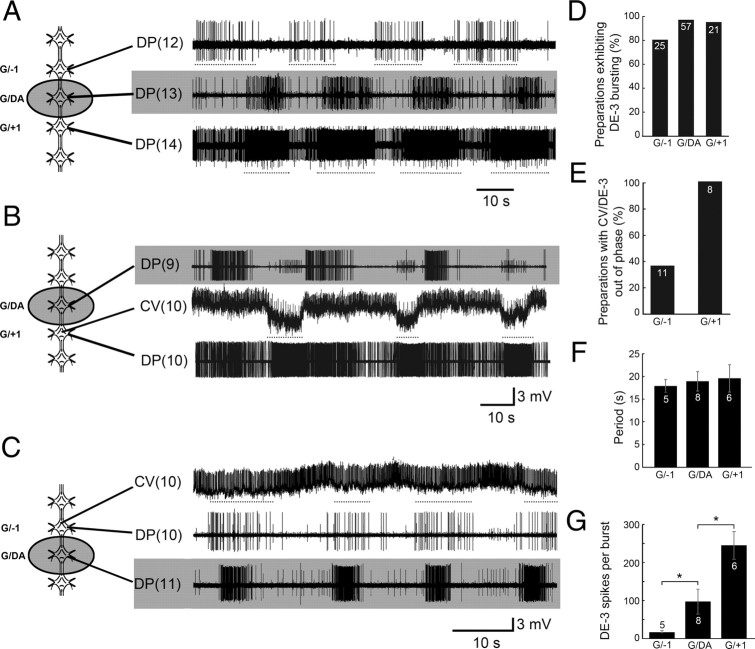
Figure 7.
Ability of a single DA-activated crawl oscillator to drive crawl-like activity in adjacent ganglia. A–C, Left, Schematic drawings indicating site of DA placement (shaded well; 100 μm DA) and specific ganglia recorded. Shaded records correspond only to those ganglia treated with DA. A, The DA-treated ganglion (G/DA, middle trace) expressed fictive crawling, which promoted crawl-like DE-3 bursting activity (dotted lines) in the adjacent anterior ganglion (G/−1, top trace) and posterior ganglion (G/+1, bottom trace). B, DA-induced fictive crawling [top trace, DP(9)] caused the untreated posterior ganglion [bottom trace, DP(10)] to show DE-3 burst-like activity. Furthermore, the intracellular record of the circular MN CV (middle trace) indicates that it is hyperpolarized (dotted lines) in phase with DE-3 excitation (bottom trace); an indicator of true fictive crawling. C, True fictive crawling, although notably quite weak, was also observed in the anterior ganglion (top and middle traces) in response to DA placed on its posterior neighbor (bottom trace); here CV was hyperpolarized (top trace, dotted lines) in phase with DE-3's depolarization (middle trace). D, Percentage of preparations exhibiting DE-3 bursting in untreated ganglia located adjacent to ganglia induced to crawl by DA. E, Percentage of preparations exhibiting anti-phasic activity in CV and DE-3 motoneurons. F, Fictive crawl-like periods (i.e., DE-3 bursts) were similar across untreated ganglia located anterior (G/−1) and posterior (G/+1) to a given DA-treated ganglion (G/DA). G, Number of DE-3 spikes/burst across untreated and DA-treated ganglia (G/−1, G/DA, G/+1). Note that the number of DE-3 spikes/burst between G/−1 and G/+1 is very different. *p < 0.05. Error bars depict ±SEM. Numbers inside the bars of D–G denote the sample sizes.

