
Figure 7.
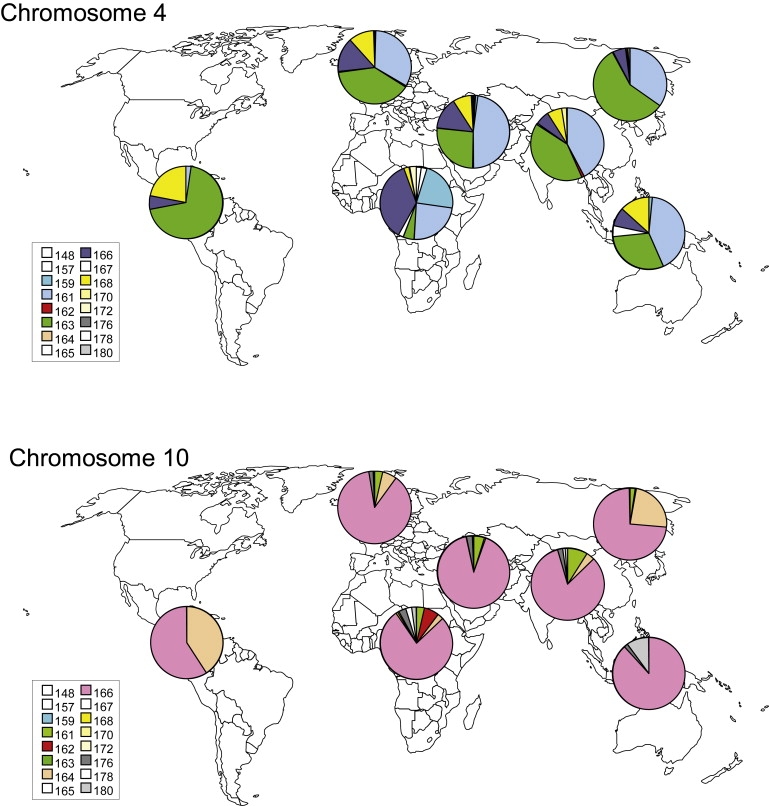
Global Distributions of the 4q and 10q SSLP Alleles
Pie charts showing the allele frequency of the SSLP locus on 4q and 10q chromosomes in seven major global regions (Africa [n = 138], Middle East [n = 163], Europe [n = 175], South and Central Asia [n = 205], East Asia [n = 241], Oceania [n = 30], and America [n = 77]). The color key is indicated on the left. Each population has a unique distribution of 4q and 10q alleles; the oldest (African) populations show the highest variation in the number of alleles, and the youngest (American) populations show the lowest variation.