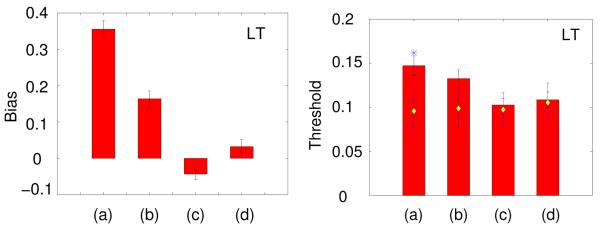
Figure 5. Other backgrounds.
Bias and thresholds in experiment 1 for one subject using all four types of background shown in figure 1. The labels (a) to (d) correspond to the labels of the conditions illustrated in figure 1. Data for the ‘target alone’, (a), and ‘rich cue’ conditions, (d), are re-plotted from figure 3. (b) shows data for the target football with a static room. (c) shows data for the target with an adjacent static football. The white diamonds show average thresholds across individual runs, as in figure 3. The asterisk (column (a), thresholds) shows data for a control condition in which the subject remained static, as described in the text.

